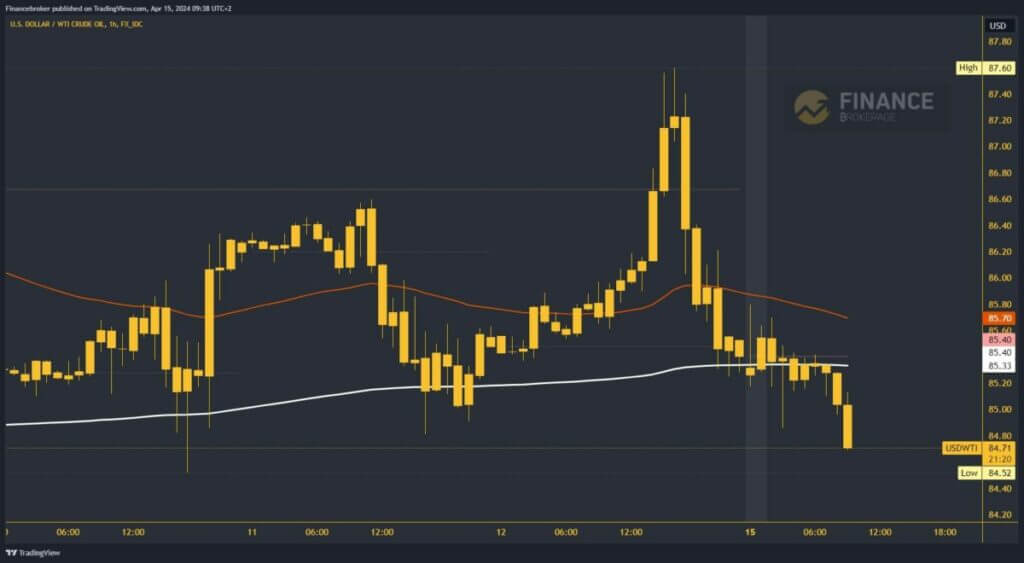
- On Friday, the price of oil rose to $87.60.
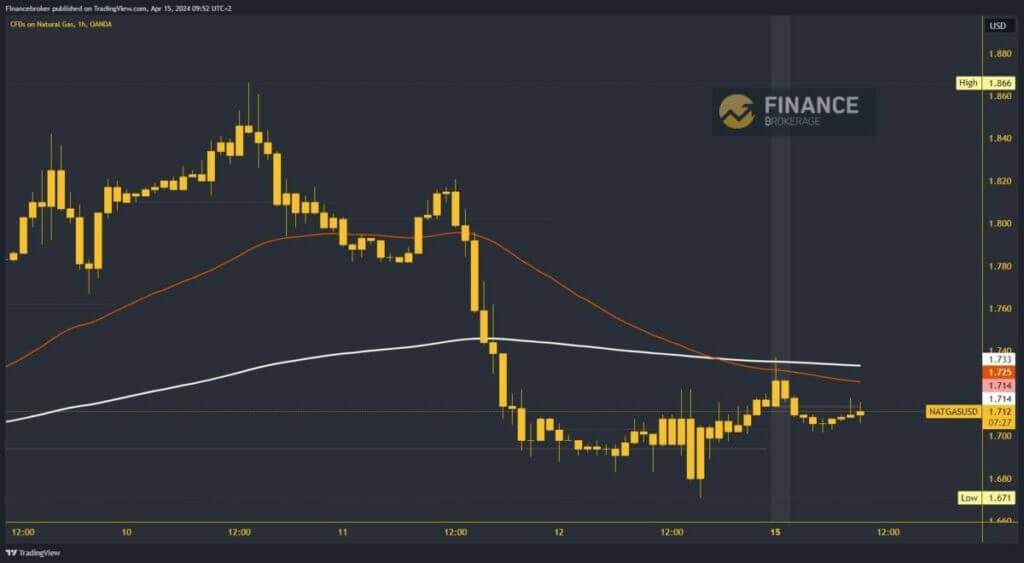
- From Wednesday to Friday, natural gas prices witnessed a continuous decline until they reached the level of $1.67.
Oil chart analysis
On Friday, the price of oil rose to $87.60. Support in that area was short-lived and was followed by a quick rebound by the end of the day to the $85.40 level. During the Asian trading session this morning, the price fell below the $85.20 level, breaking below the EMA200 moving average. The pressure on the oil price increases, and it falls to the $84.70 level, forming a new five-day low.
The current bearish consolidation could easily push the price down in search of new support. Possible lower targets are the $84.60 and $84.40 levels. We need a positive consolidation and a return above the $85.40 level for a bullish option. This is where we get back above the 200 EMA and the weekly opening price. We are moving to the upside, and with support from the 200 EMA, we can start further recovery. Possible higher targets are $85.60 and $85.80 levels.

Natural gas chart analysis
From Wednesday to Friday, natural gas prices witnessed a continuous decline until they reached the level of $1.67. This is where we were able to get support and start recovering from there. The price rose to $1.74 levels this morning during the Asian session. This is where we encounter the EMA200 moving average. We failed to move higher, and another pullback occurred, this time to the $1.70 level. We will try to get new support here and start with positive support from there.
By breaking above $1.74, we are clearing the 200 EMA and hopefully supporting it for a further recovery to the upside. Possible higher targets are the $1.76 and $1.78 levels. We need to pull back below the $1.70 level to get a bearish option. After that, we are looking at the area around $1.68 and we will try to look for new support there. Possible lower targets are the $1.67 and $1.66 levels.


