- Since the beginning of April, the price of gold has risen to a new all-time high.
- The price of silver has been on a continuous upward trend since the beginning of this week.
Gold chart analysis
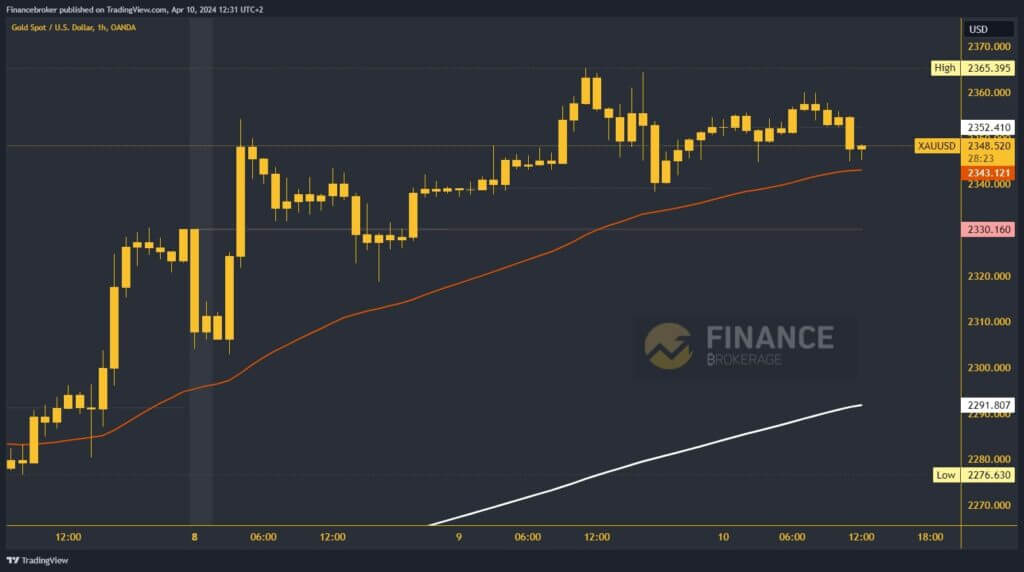
Since the beginning of April, the price of gold has risen to a new all-time high. We also saw that yesterday, with a jump to the $2,365 level. After that, the price fell to the support at $2,340. From there, we start a new positive consolidation and move back above the $2,350 level. During the Asian session, we rose to the $2360 level; We now have resistance at this level. Gold is falling to $2,345 and looking for support at the EMA50.
If we get the required support, we will be able to start a new positive consolidation and recovery of the gold price. Possible higher targets are $2365 and $2370 levels. We need to break below the EMA0 level and the $2340 level for a bearish option. By going below there, we head to the weekly opening price at $2,330. Weak support in that area would trigger a drop to a new weekly low and move the price to the downside.

Silver chart analysis
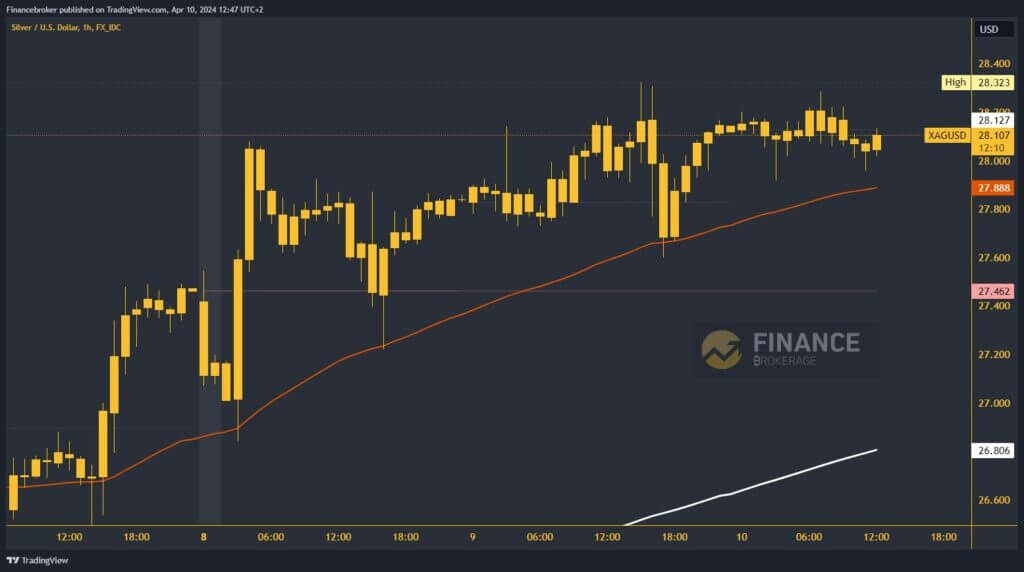
The price of silver has been on a continuous upward trend since the beginning of this week. We rose to $28.32 yesterday, forming a new weekly high. After that, we return to the $27.80 support level and face the EMA50. From there, the price begins to consolidate upward and returns above $28.00. If the current movement continues, it is very likely that we will see silver hit a new high.
Possible higher targets are the $28.20 and $28.40 levels. For a bearish option, we need a negative consolidation and a pullback below the $27.80 level. Thus, we head towards a new daily low and get confirmation of the downward momentum. Possible lower targets are the $27.60 and $27.40 levels.


