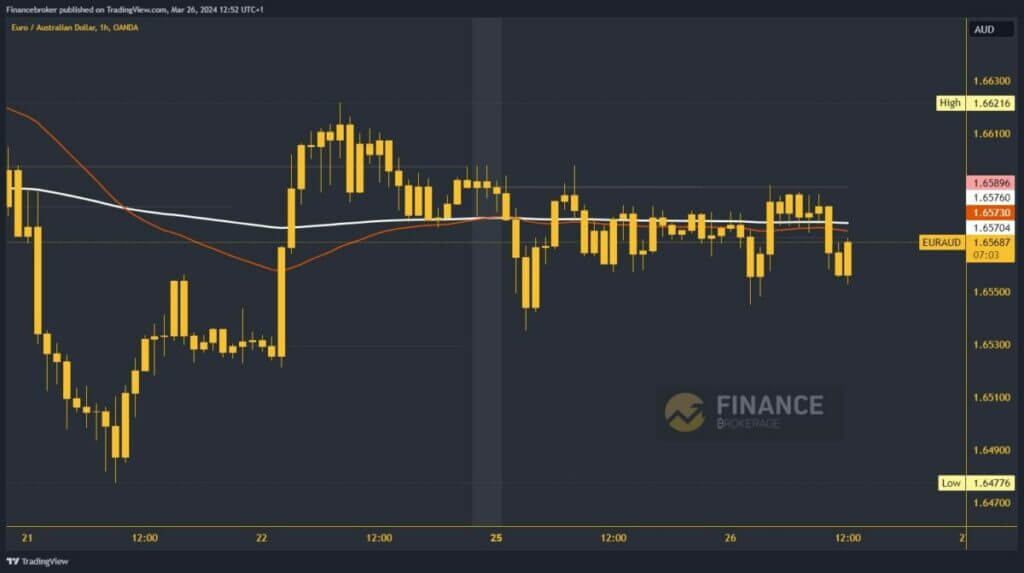

- In the first two days of this week, the EUR/AUD moved in the 1.65450-1.65900 range.
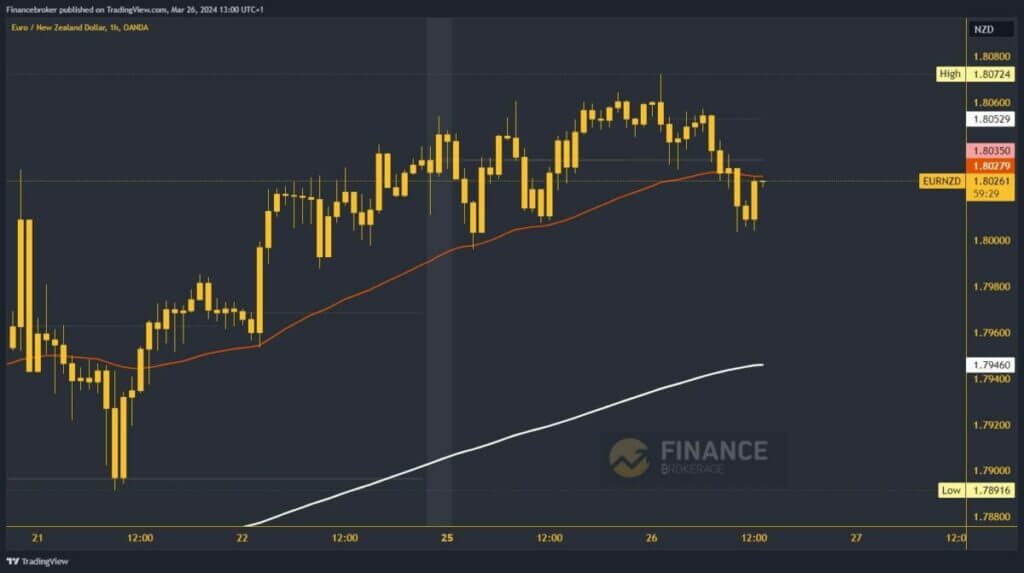
- During the Asian trading session, EUR/NZD rose to a new weekly high of 1.80724.
EURAUD chart analysis
In the first two days of this week, the EUR/AUD moved in the 1.65450-1.65900 range. During the Asian trading session this morning, we tried to press the upper line but failed to move above it. After that, the pair starts to decline and approaches the 1.65500 level. If we do not get support here, we can expect to see a drop to a new low. Possible lower targets are 1.65400 and 1.65300 levels.
To be bullish, we need to get back to the 1.65900 level and above the EMA200. After that, it needs to push up and grow to a new weekly high. With this step, we get rid of the downward pressure and expect the recovery to continue. Possible higher targets are 1.66000 and 1.66100 levels.

EURNZD chart analysis
During the Asian trading session, EUR/NZD rose to a new weekly high of 1.80724. After that, we stop there and pull back below the 1.80500 level. We could not stop but continued to decline at 1.80000 levels. Here we find new support and successfully maintain the above. We have moved to the 1.80250 level, where we now have resistance at the EMA50.
This may prevent us from getting back to the upside and starting to pull back. Possible lower targets are 1.79800 and 1.79600 levels. The 200 EMA is located in the area around 1.79500 levels. If we can get back above 1.80350 and move above the weekly open price, we will be on the positive side again. After that, we will have a chance for a new bullish consolidation. Possible higher targets are 1.80600 and 1.80800 levels.


