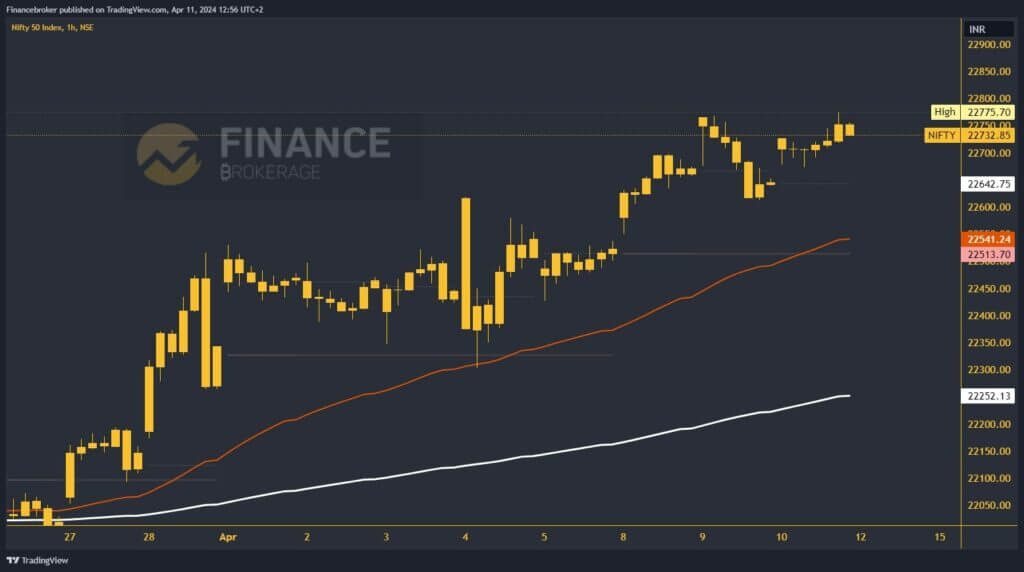
- The Nifty index rose to a new all-time high yesterday at 22,775.70.
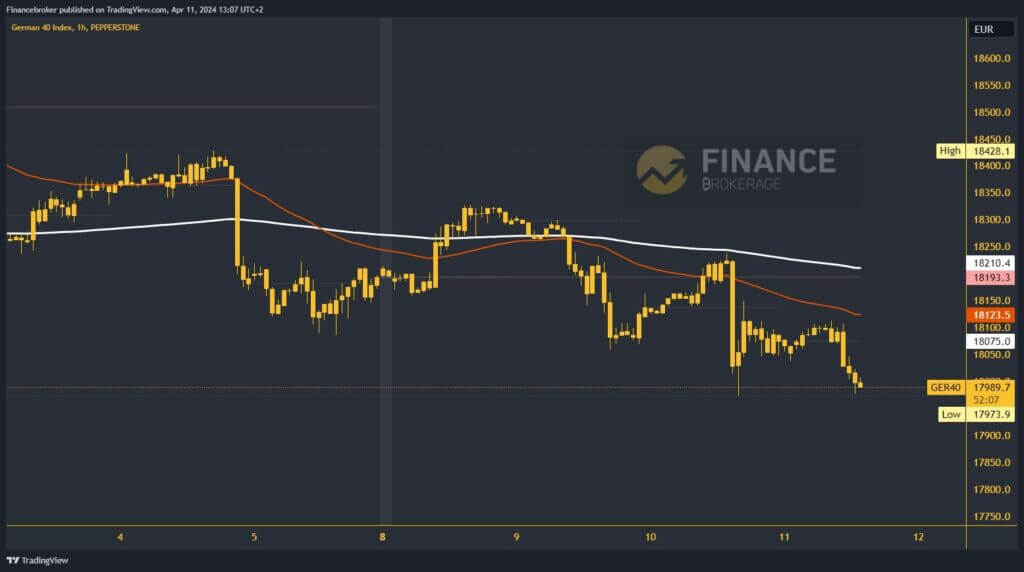
- This week the German 40 index is experiencing a bearish signal until the support level of 18000.0.
Nifty indicator chart analysis
The Nifty index rose to a new all-time high yesterday at 22,775.70. This happened at the end of the session, and at the close the index fell slightly to 22732.85 levels. We will see how the next session will open and in which direction the motivation will go. It is possible that we will see a new bullish wave and thus rise to a new high. Possible higher targets are 22800.00 and 22850.00 levels.
A decline in the value of the index below the 22700.00 level would lead to a downward consolidation, and we should be careful if we fall to the previous low at the 22600.00 level. If we fail to hold above this level, a new decline and break of the bullish pattern will follow. Possible downside targets are 22500.00 and 22400.00 levels.

German chart analysis 40
This week the German 40 index is experiencing a bearish signal until the support level of 18000.0. Yesterday, we successfully tested this level for the first time. This was followed by a sideways move for the pair during the Asian session this morning.
With the beginning of the EU session, the index begins with a downward consolidation and retreats to the support level of 18000.0. We are slowly sliding down, and there is a high chance that we will reach a new weekly low.
Possible lower targets are 17950.0 and 17900.0. We need positive stability and start above 18150.0 for a bullish option. There, we are back above the EMA50, and with its support we can attack 18200.0 and the EMA200.
By moving above, optimism is enhanced for further continuation to the upside. Possible higher targets are 18300.0 and 18400.0 levels.


