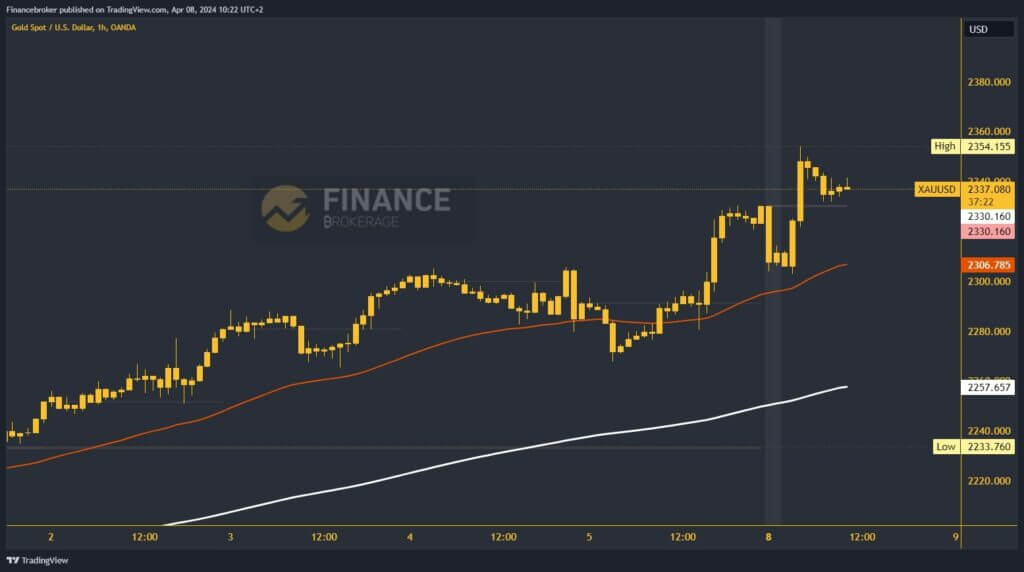
- Last week, we saw the price of gold break the $2,300 barrier for the first time.
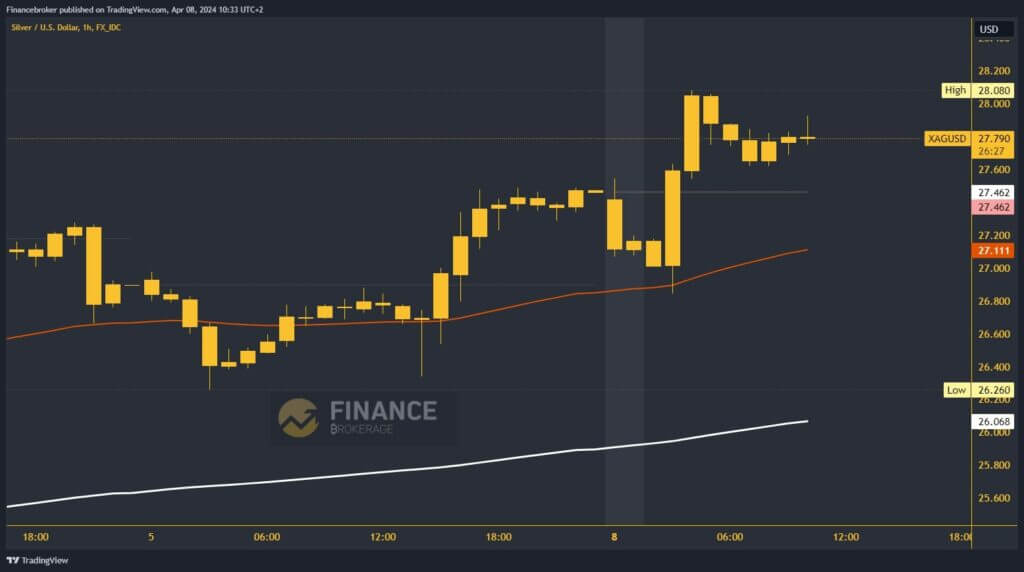
- The price of silver rose to a new three-year high this morning at $28.08.
Gold chart analysis
Last week, we saw the price of gold break the $2,300 barrier for the first time. On Friday evening, when the market closed, the price rose to the $2,330 level. During the Asian trading session this morning, we saw the first pullback to the $2,303 level, thus testing the support level at $2,300. Then, with two strong bullish impulses, the price jumps to a new all-time high at $2,354.
We then saw a pullback to $2330 and are testing the weekly open there. For now, we have managed to hold above and go towards the $2340 level. It could easily happen that we soon see a new bullish impulse and the price of gold at a new all-time high. Possible higher targets are $2,360 and $2,370 levels. Growing tensions in the Middle East between Israel and Iran will only support the gold price in its upward trend.

Silver chart analysis
The price of silver rose to a new three-year high this morning at $28.08. After that, we stopped there and fell to support the $27.60 level. For now, we were able to stay above and recover a little to the $27.80 level. We need this positive consolidation to continue now to start further recovery and retest the $28.00 level. Possible higher targets are the $28.20 and $28.40 levels.
We need negative consolidation and a fresh pullback below the $27.60 level for a bearish option. Next, we look at the weekly opening price at $27.46. With the drop lower, we move to the downside, and silver will have to look for a new support level. Possible lower targets are the $27.20 and $27.00 levels. Additional support in the area around $27.10 is the EMA50 moving average.


