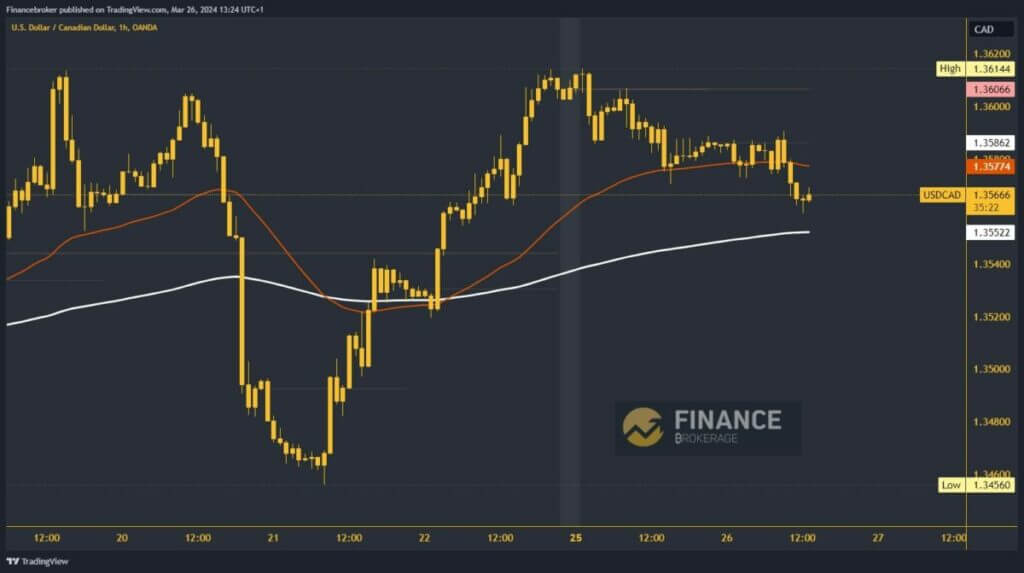
- USD/CAD has been on a decline since the beginning of this week.
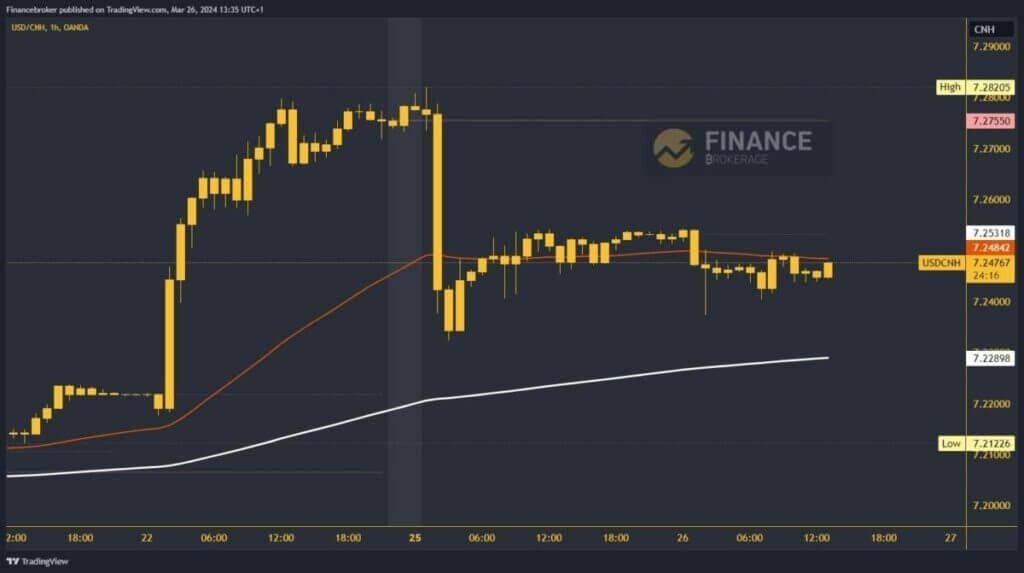
- On Monday, at the beginning of the Asian session, there was a sudden drop in the USDCNH pair from 7.28000 to 7.23500.
USDCAD chart analysis
USD/CAD has been on a decline since the beginning of this week. We started at level 1.36066 and now at level 1.35640. We are approaching the 200 moving average at 1.35520 and testing this support level. During the Asian trading session, we faced resistance at the level of 1.35900, after which the pair started to decline in the European session. Going down to the 200 SMA and below will only increase downward momentum.
Possible lower targets are 1.35500 and 1.35400 levels. We need to get back to the resistance area around 1.35900 for a bullish option. Then we also need to continue there. With new momentum, we move higher and start an upward consolidation. Possible higher targets are 1.36000 and 1.36200 levels.

USDCNH chart analysis
On Monday, at the beginning of the Asian session, there was a sudden drop in the USDCNH pair from 7.28000 to 7.23500. Continuing today, the movement occurs in the 7.24000-7.25500 range. The pair is still under some pressure, which may negatively affect the movement and push us towards lower levels. Possible lower targets are 7.23000 and 7.22000 levels.
Additional support is the EMA200 moving average in the area around 7.23000 levels. If we are considering a bullish option, we need to get back above the 7.25500 level. After that, we need to hold there and form a bottom there. After that, we can expect to continue to the upside and go higher. Possible targets are 7.26000 and 7.27000 levels.


