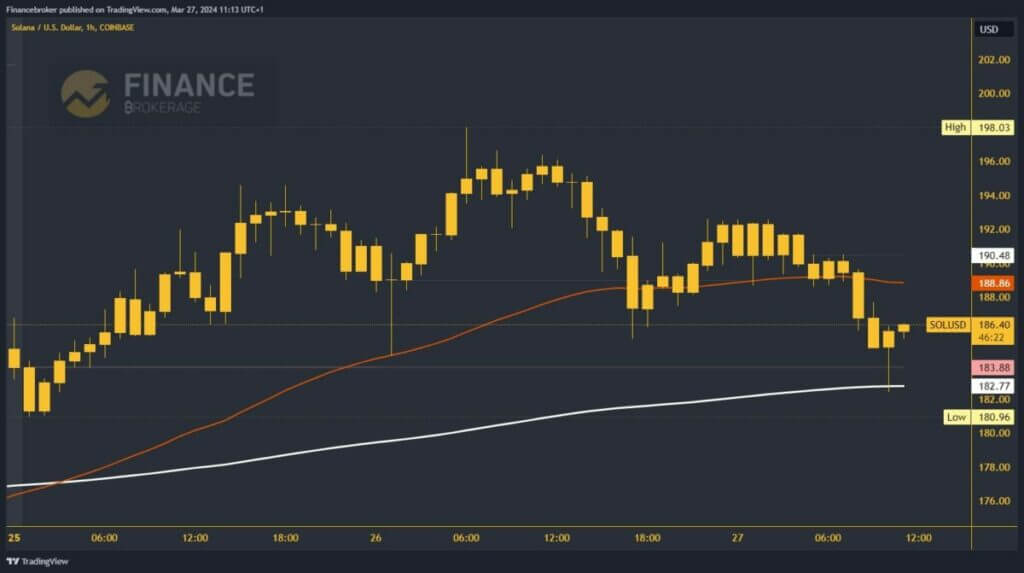
- Solana price declined from yesterday's high to $182.00.
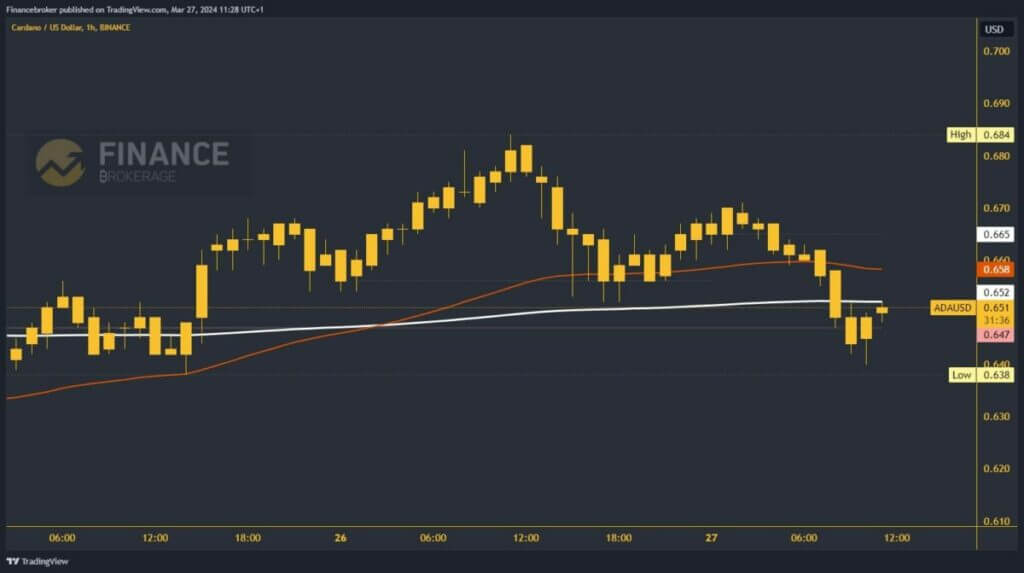
- Cardano price fell today to the 0.640 level at a new daily low.
Solana chart analysis
Solana price declined from yesterday's high to $182.00. We were close to reaching the $200.00 level yesterday but stopped at $198.00. This was followed by a first decline to the $185.00 level. Then we saw a bounce attempt, but it stopped at the $192.70 level. From there, we continue to fall to today's low.
Here, we are facing the EMA200, which is successfully keeping us above it. This could push the price to start another positive consolidation and take us back to the $190.00 level. With this move we start above the 50 moving average and get its share. After that, it will be easier for us to start further recovery. Possible higher targets are $192.00 and $194.00 levels.

Cardano chart analysis
Cardano price fell today to the 0.640 level at a new daily low. Additional pressure creates a decline below the EMA200 moving average. This may lead to a continuation of negative consolidation and a decline below today's low to a new level. Possible lower targets are 0.630 and 0.620 levels.
For the bullish option, we need to get back above the 200 moving average and the 0.650 level. This brings us back to the positive side. Next, we need a positive consolidation and return to 0.665, the daily opening price. A test and break above this level will enhance the bullish momentum and push Cardano price. After that, we can expect the price to rise to a new daily high above the 0.670 level. Possible higher targets are the 0.680 and 0.690 levels.


