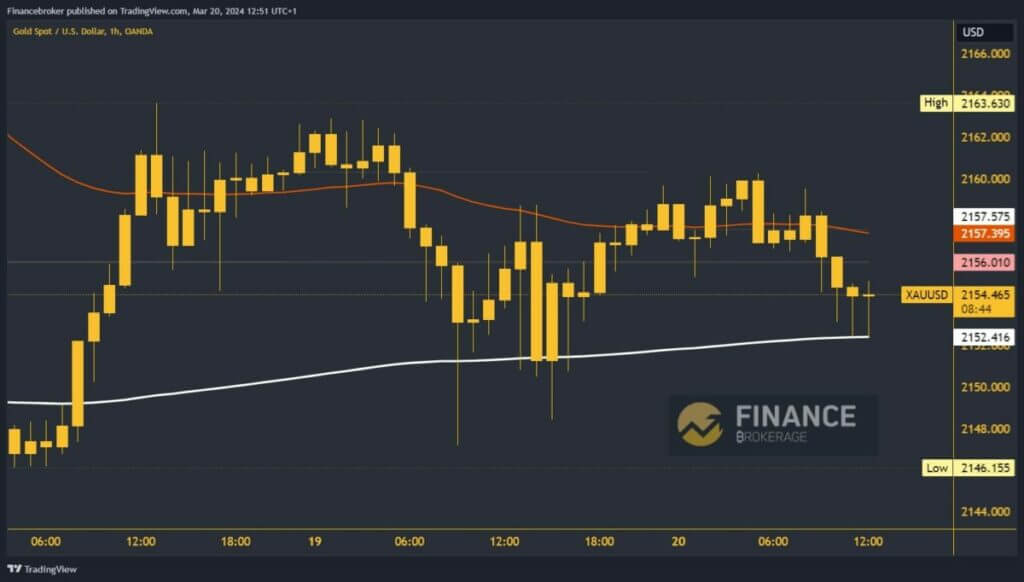
- Yesterday, the price of gold reached the $2,160 level and formed a new high there.
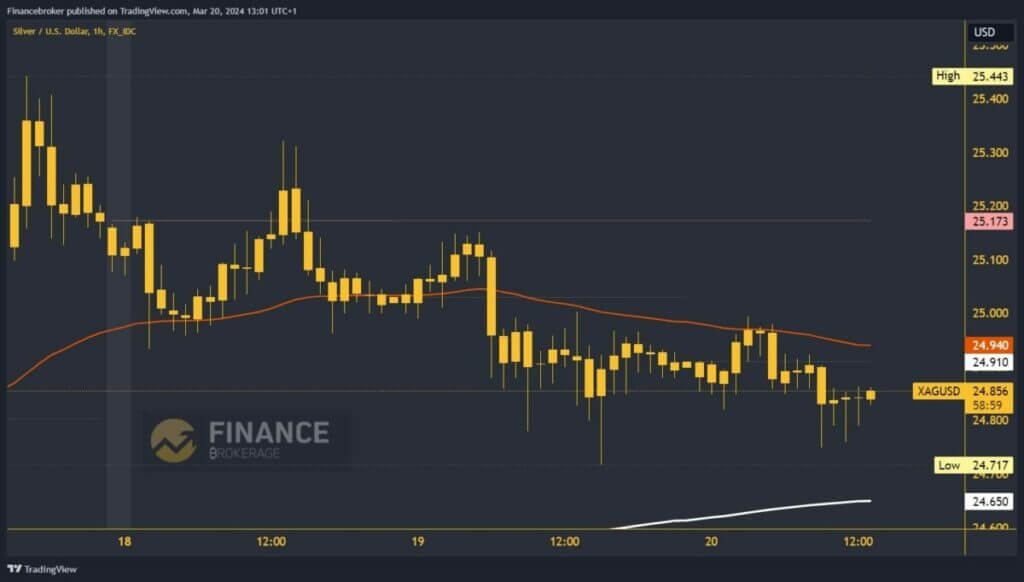
- The price of silver has been declining since the beginning of this week.
Gold chart analysis
Yesterday, the price of gold reached the $2,160 level and formed a new high there. This is a smaller rise compared to Monday, suggesting that gold does not have much strength and a pullback is coming. This happened during the Asian session this morning, and the price fell below the $2,155 level. The decline stopped at $2,152, where we also met the EMA200 moving average. For now, we remain stable above this level and move towards $2154.
We need positive reinforcement to get back to the $2160 area. Above, we have a better position to initiate upside resistance with the next impulse wave. Possible higher targets are $2162 and $2164 levels. For a bearish option, we need a negative consolidation and a drop below $2152 and the 200 moving average. Thus, we fall below the support level, which intensifies the downward pressure. Possible lower targets are the $2150 and $2148 levels.

Silver chart analysis
The price of silver has been declining since the beginning of this week. Yesterday, we saw a stronger decline below the $25.00 level to $24.71. Since then, we have been consistently below $25.00 and under pressure from the EMA50. This morning, we had one bullish attempt during the Asian session to move above the level but failed to do so. Bearish consolidation followed by a decline to $24.75.
If this week's trend continues, the silver price will be forced lower. Possible lower targets are the $24.70 and $24.65 levels. The EMA200 moving average provides additional support for silver in the $24.65 area. For a bullish option, we need to get back to the area around $25.00. With a breakout higher, we are freed from the downward pressure, and it will be easier for us to continue the recovery.


