The S&P 500 fell, and the Nasdaq fell below 17900.0
- On Friday, the S&P 500 fell to test the 5100.0 support level.
- The Nasdaq continues to decline at the beginning of the week.
S&P 500 chart analysis
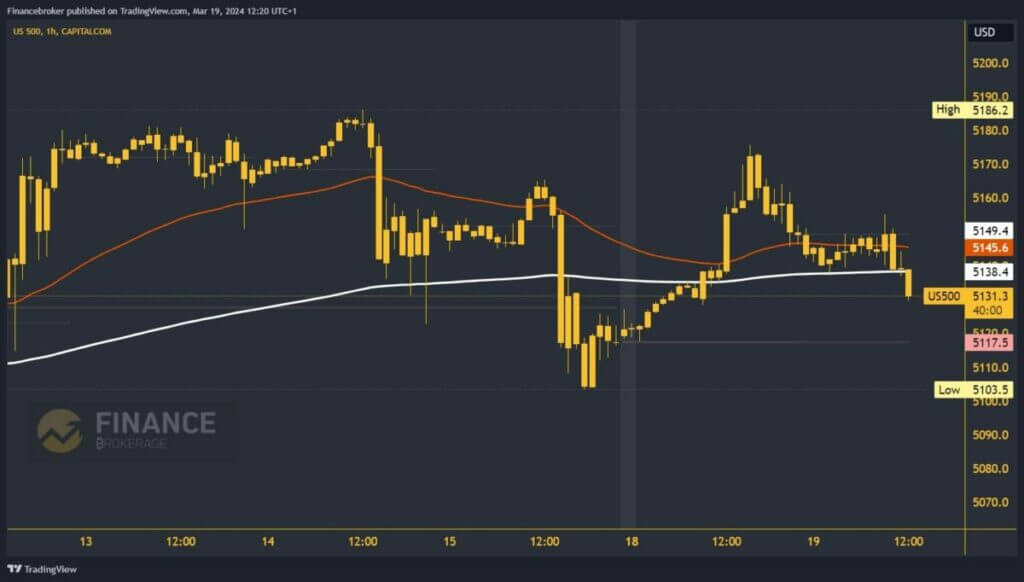
On Friday, the S&P 500 fell to test the 5100.0 support level. We successfully tested this level and started consolidating upwards above 5150.0. The index value rose yesterday to 5175.9. We stopped there and started to pull back to the 5150.0 level. During the Asian trading session this morning, the index failed to move above this level.
There was a drop below 5140.0 and the EMA200, which is now putting additional pressure on the indicator. The S&P 500 fell to 2130.0, and there is a high probability that it will fall further. Possible lower targets are 5120.0 and 5110.0 levels. We need a positive consolidation and a return above the 5150.0 level for a bullish option. After that, we can hope for the start of bullish consolidation and recovery of the index.

Nasdaq chart analysis
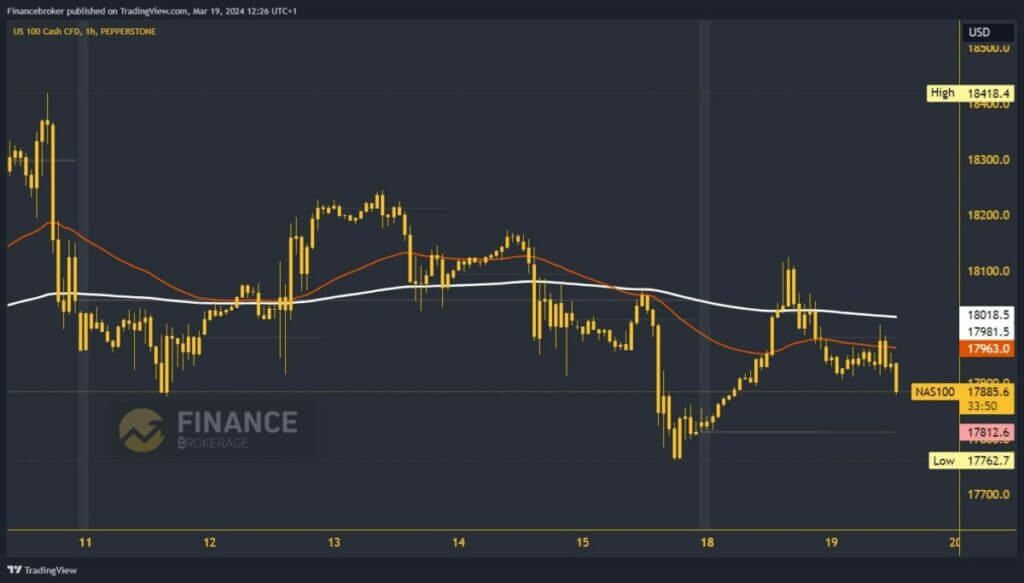
The Nasdaq continues to decline at the beginning of the week. First, we made a new low at 17762.7 on Friday. After that, yesterday we saw a break of the 18100.0 level and the formation of a lower high there compared to the high recorded last week. This confirms that the indicator is still in a downward trend. The new confirmation was a drop below the 18000.0 level and the EMA200.
This increases pressure on the already weak Nasdaq, pushing it below the 17900.0 level. We are now at 17880.0 at a new daily low. Downward momentum may allow us to easily reach the weekly opening price. Below that, we are on track for a new low regarding Friday. Possible lower targets are 17800.0 and 17700.0 levels.

The post S&P 500 declines, Nasdaq falls below 17,900.0 appeared first on FinanceBrokerage.

