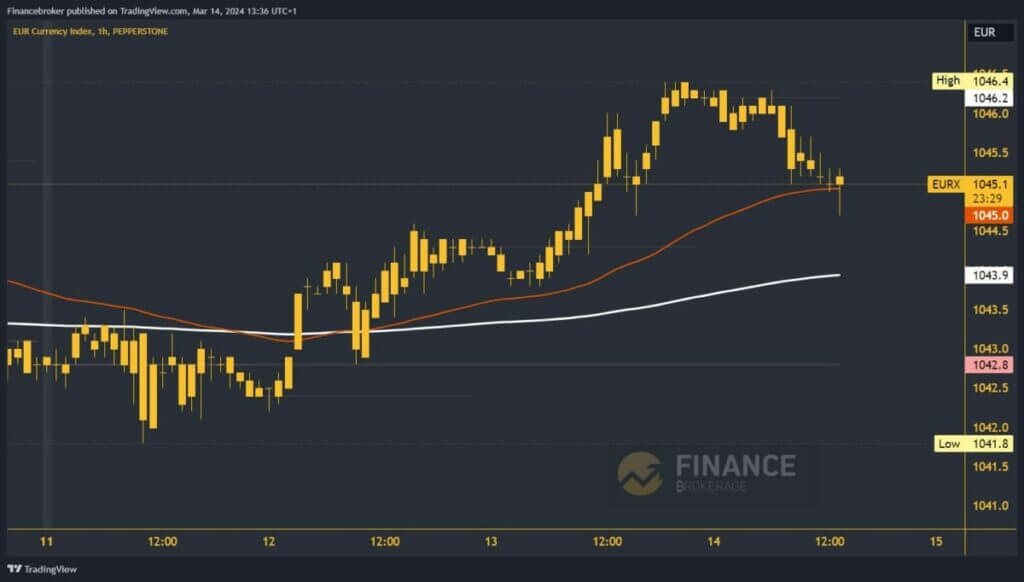
- The highest index for the euro this week was formed on Wednesday at 1046.4.
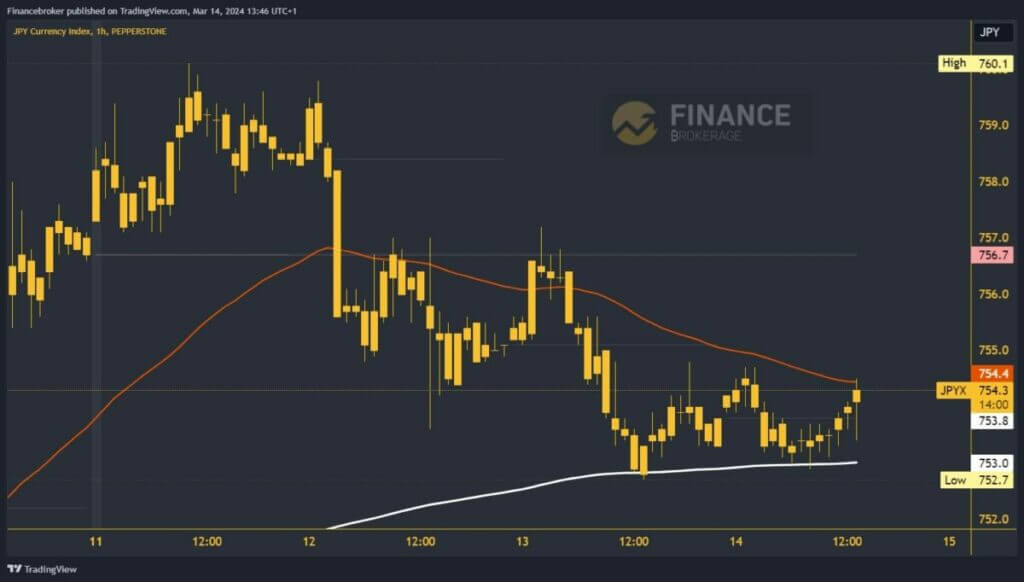
- The yen index has been declining since Monday after stopping at 760.1.
Analysis of the Euro index chart
The highest index for the euro this week was formed on Wednesday at 1046.4. We stopped at this level, and during the Asian trading session, we slowly moved away from it. In the European Union session, the index value continued to decline to a new daily level at 1044.8. Today's bearish consolidation could take us to a new low. Possible lower targets are 1044.50 and 1044.0 levels.
The EMA200 moving average provides additional support to the indicator and the area is around 1044.0. If we stay above it, we have a new chance to recover. For the bullish option, we hope that the EMA50 will gain support and stay above the 1045.0 level. If we succeed, we can start an upward consolidation and hopefully recover to the previous high. Possible higher targets are 1046.0 and 1046.5 levels.

Yen indicator chart analysis
The yen index has been declining since Monday after stopping at 760.1. On Tuesday we saw a strong bearish push, followed by a consolidation and drop yesterday to a weekly low of 752.7. There, we met the EMA200 and stayed above it. Today, we are looking for a slight upward consolidation from 753.0 to 754.0. On the upside, the EMA50 represents new resistance.
We hope to see a new impulsive wave that will push us higher and make it easier for us to continue the uptrend. Possible higher targets are 755.0 and 756.0 levels. If we return to the 753.0 level, the yen index will be under pressure to look for support again at the EMA200. A revisit could easily destabilize the indicator's value and send it to a new weekly low. Possible lower targets are 752.0 and 751.0 levels.


