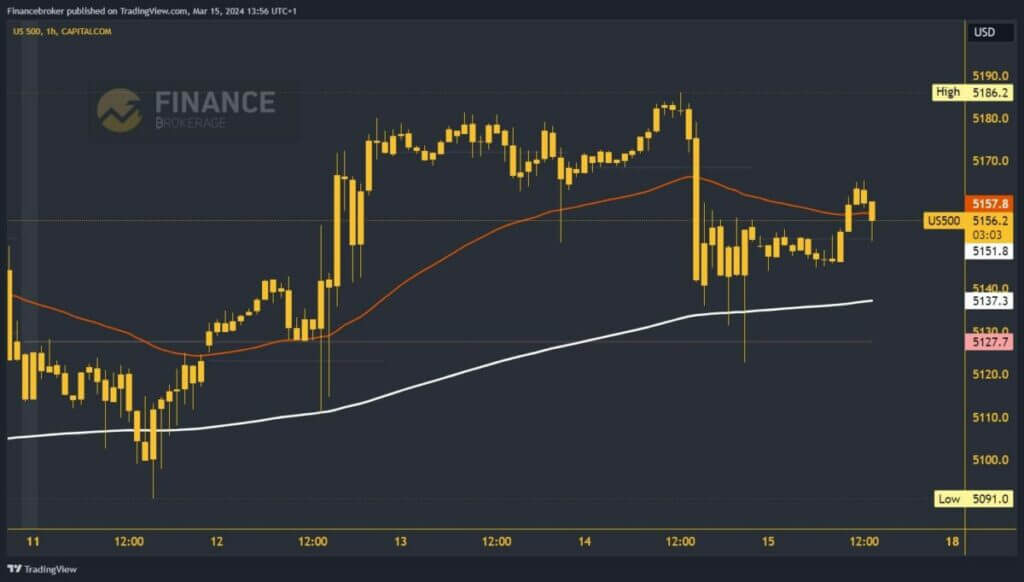
- The S&P 500 index's attempt yesterday to reach a new high level stopped at 5186.2.
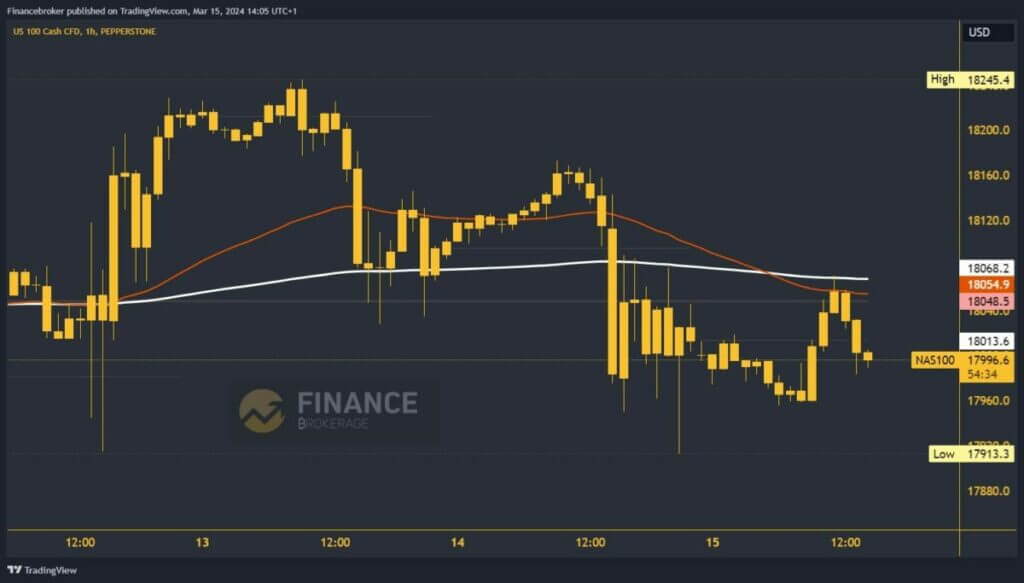
- The highest value this week for the Nasdaq index was on Wednesday at 18245.4.
S&P500 chart analysis
The S&P 500 index's attempt yesterday to reach a new high level stopped at 5186.2. After that, two bearish impulses took us to the 5140.0 support level. Since then, we have been sideways consolidating in the 5140.0-5155.0 range. We have additional support at the 200 moving average and hope to continue and grow on the upside. During the Asian session, the indicator gave us indications that we may see a breakout higher and rise to a new daily high.
This is what happened with the jump to 5165.0 levels. We succeeded in holding above 5155.0 and we expect a retest and a new pulse to continue the upward trend. Possible higher targets are 5170.0 and 5180.0 levels. We need negative consolidation and drop to 5140.0 level and EMA200 support level for a bearish option. A break below pushes the index to form a new weekly low, and possible lower targets are the 5130.0 and 5120.0 levels.

Nasdaq chart analysis
The highest value this week for the Nasdaq index was on Wednesday at 18245.4. After that, we saw the start of downward consolidation reaching the 18030.0 level. We managed to stay above it on Wednesday and got support from the EMA200 moving average. On Thursday, we rose to the level of 18175.0, where we encountered new resistance and formed a new lower high compared to the previous day.
From this level, we started another pullback until last night at 17913.3. During the Asian session, we returned above the 17960.0 level and are now trying to stabilize around the 18000.0 level. Today's resistance is located at 18070.0 level of the EMA200 moving average. For now, we stay below and look to the downside. A fresh push could easily take us below the 17960.0 support level, and possible lower targets are the 17920.0 and 17900.0 levels.


