In a recent technical analysis update, a cryptocurrency analyst known as Dark Defender provided insight into XRP price movements against the US Dollar. The analyst uses Elliott Wave Theory to analyze XRP price movements. This approach, rooted in the psychological patterns of market participants, shows price trends through a distinct cycle of 3-5 waves.
This includes five waves that follow the direction of the primary trend and three corrective waves. According to Dark Defender, XRP has been showing an upward trend since January 2023, and is undergoing an “ABC” correction phase from November 2023 to February 2024. This phase has paved the way for a new bullish wave sequence.
welcome. I hope you had a great weekend.
Let's first check our previous pattern and update it.#XRP It is hovering precisely around the Fibonacci level at $0.6462. The lines are clear and precise.
By checking the MACD, Ichimoku and RSI indicators, XRP is expected to continue the upward trend as… pic.twitter.com/fetf2IH7nl
— Dark Defender (@DefendDark) March 4, 2024
XRP price is eyeing $1 by the end of March
The current market dynamics of XRP are encapsulated in a specific wave pattern from (1) to (4), according to Elliott Wave principles. The initial wave peaked on February 16, 2024, reaching nearly US$0.58, showing strong market sentiment as the subsequent second wave correction was modest, stopping at US$0.525 rather than fully returning to the wave's starting point (1).
XRP is currently traveling through wave (3), which is often the longest and strongest, indicating a potential rise towards the $0.81 mark. The upcoming wave (4) is expected to be corrective, with expectations of a decline to around $0.75, leading to the final trend of wave (5) targeting the $0.9191 to $1 range by late March.
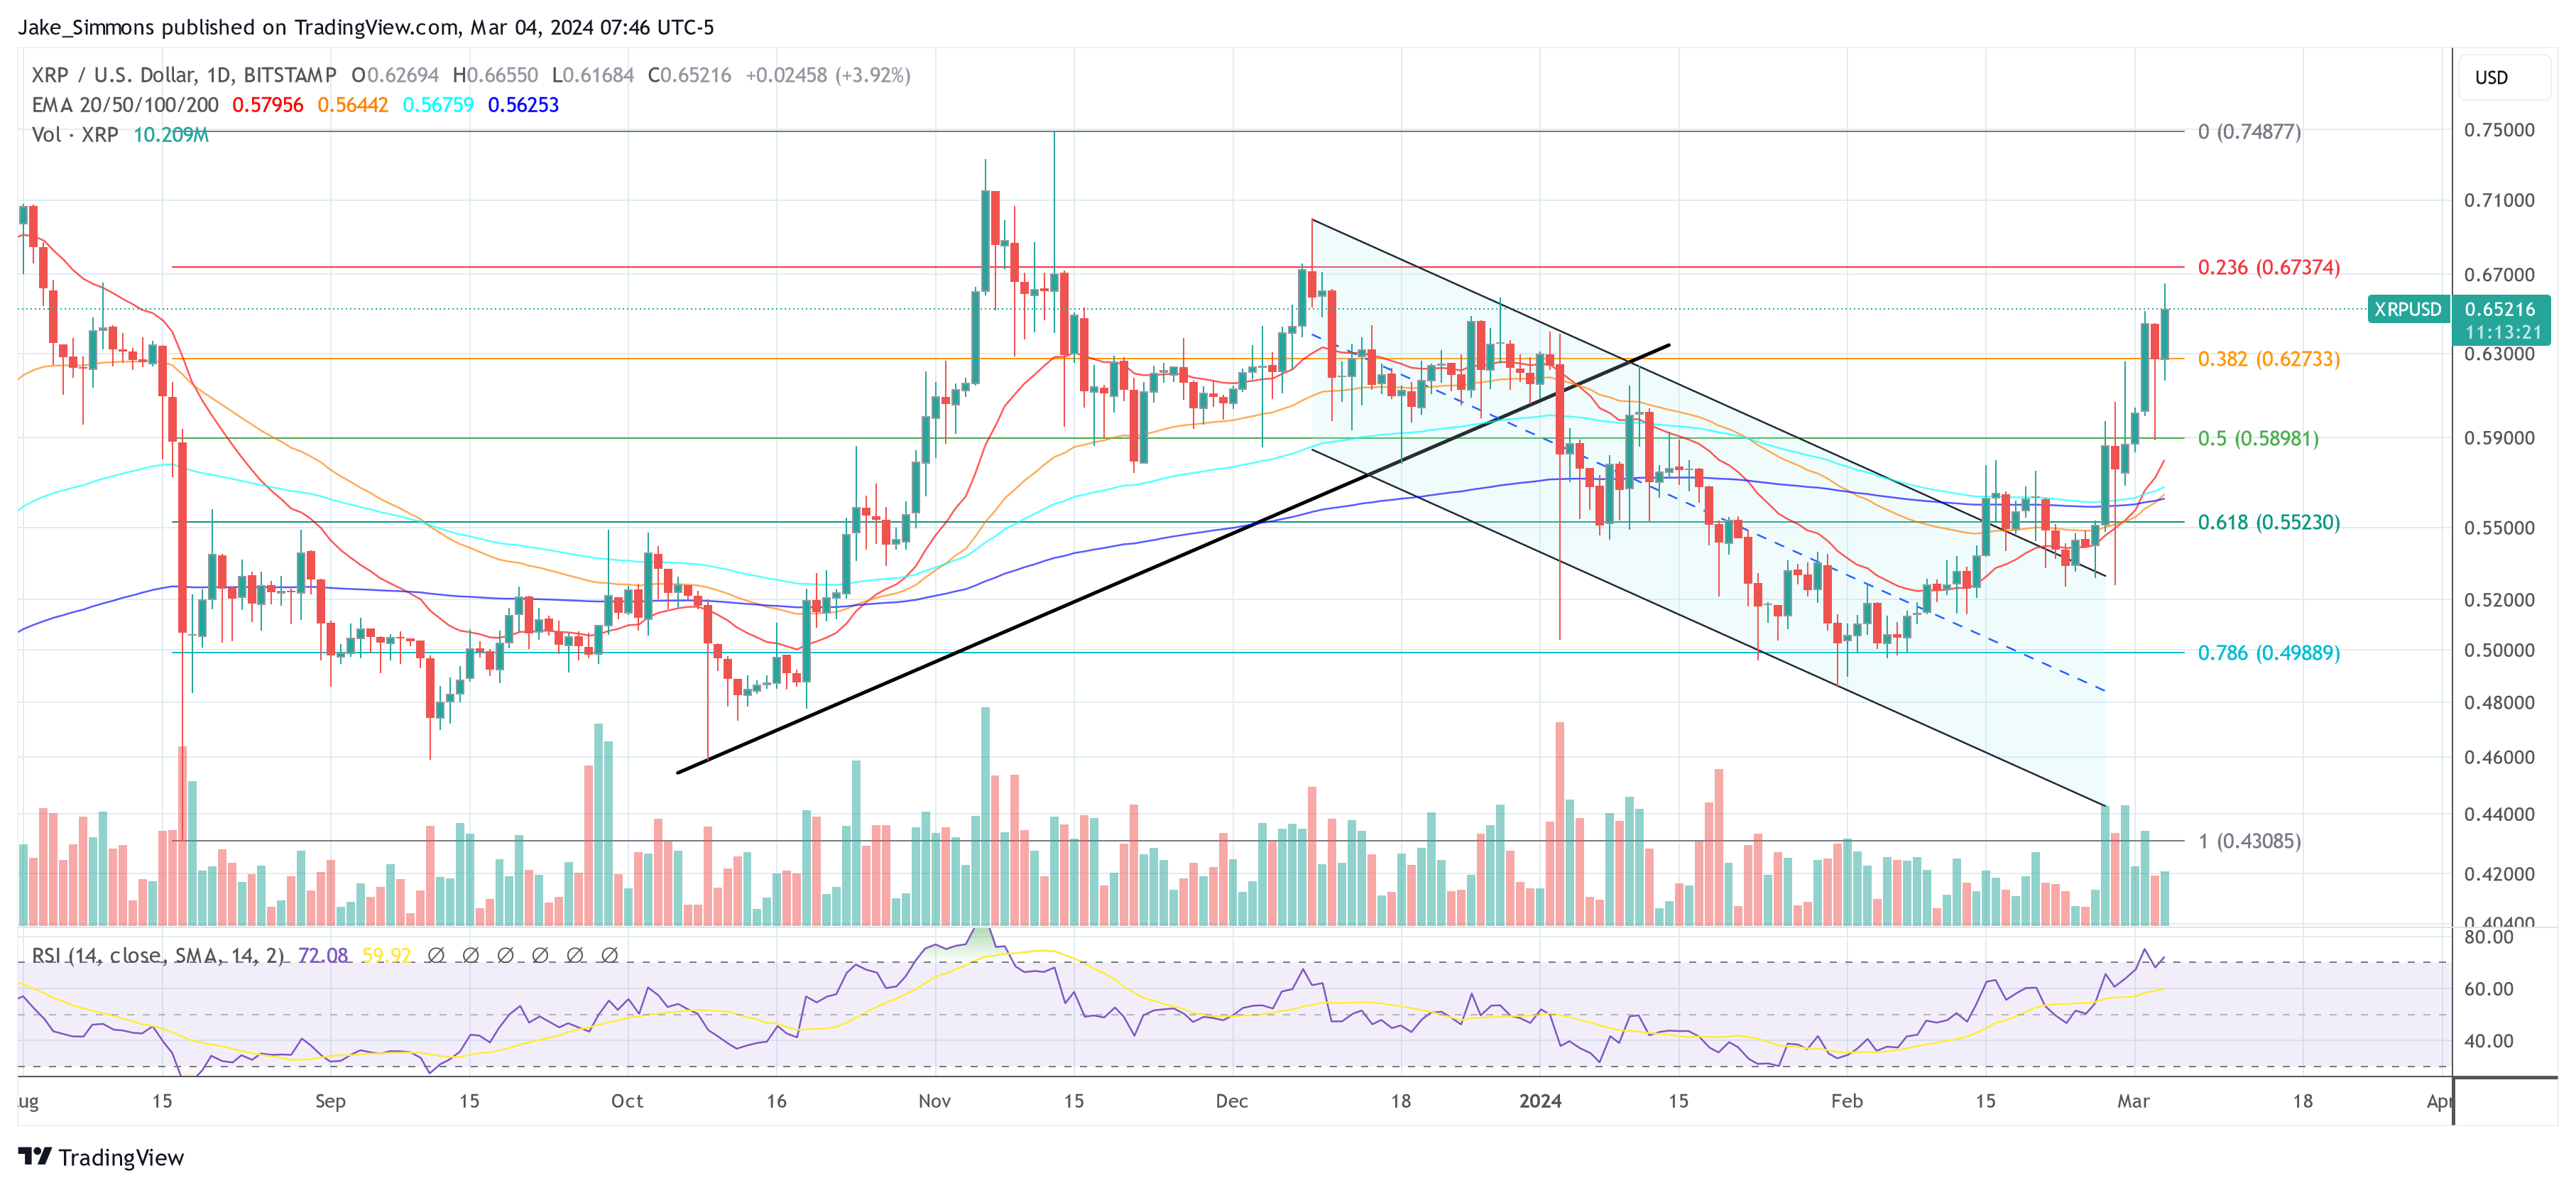
It is worth noting that Dark Defender's analysis also includes Fibonacci retracement levels, which further improves predictive accuracy by identifying potential market support and resistance points. XRP price recently crossed an important resistance level, which was previously identified as a downtrend line (red) originating from point (B) on the chart.
This breakout indicates a strong bullish signal, as resistance has turned into a support level. Dark Defender highlighted that resistance has been “eliminated”, indicating that previous price ceilings are no longer restricting upward movement.
However, a notable challenge lies in the 161.8% Fibonacci level at $0.6462, which has already repulsed the price on several occasions. Overcoming this barrier is crucial to maintaining the wave's momentum (3). The analysis forecasts an ambitious breakout above the 261.8% Fibonacci level at $0.7707 during wave (3), albeit with an expected correction below this threshold in wave (4), using the November 2023 high as a pivotal support marker.
For traders, these ideas emphasize the importance of monitoring Fibonacci levels and wave patterns to gauge future moves. However, the subjective nature of wave analysis requires corroborating evidence from other technical indicators to obtain a comprehensive market forecast.
To this end, Dark Defender pointed to additional technical tools, including the Moving Average Convergence and Divergence (MACD), the Ichimoku Cloud, and the Relative Strength Index (RSI). Although the analysis does not visually break down these indicators, the commentary suggests that all three support XRP's continued uptrend, reinforcing the prediction of a continued uptrend. “Checking the MACD, Ichimoku and RSI indicators, XRP is expected to continue the upward trend as we expected,” he said.
At press time, XRP was trading at $0.65216.

Featured image from Shutterstock, chart from TradingView.com

