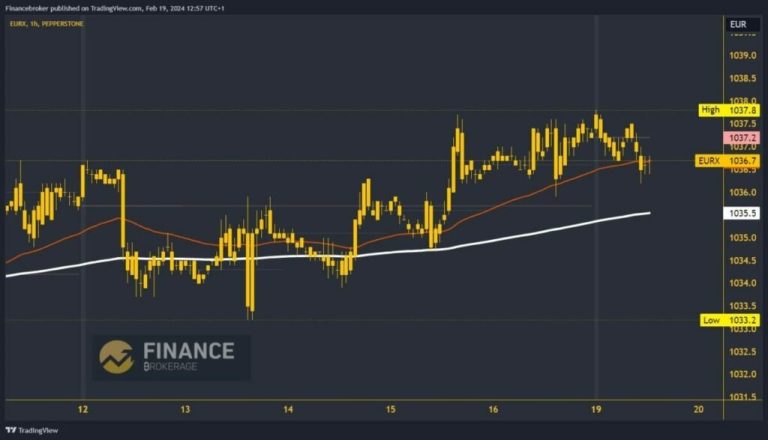
- Last week, until midday on Tuesday, the euro index fell to its support at 1033.2.
- Last week, only Monday was positive for the Yen index, as we saw a jump to 755.3 levels.
Analysis of the Euro index chart
Last week, until midday on Tuesday, the euro index fell to its support at 1033.2. After successfully getting support, we see the start of bullish consolidation and return above the EMA200. With its support, the euro continues to grow more easily, reaching 1037.8 levels. This is where we encounter resistance and pullback during the Asian session this morning.
A daily low has been formed at 1036.5, and we are under pressure to start further decline. Possible lower targets are 1036.0 and 1035.5 levels. In the area around 1035.5 levels, we face the EMA200 moving average again. It is very likely that we can get support again and start an upward consolidation from this level.

Yen indicator chart analysis
Last week, only Monday was positive for the Yen index, as we saw a jump to 755.3 levels. From there, we started to pull back very quickly, and on Tuesday, we dropped to 748.7 levels. On Wednesday we saw a recovery to 752.5 levels, and there we formed a lower high compared to Monday. Lack of resilience there leads to bearish consolidation and Friday drop to 748.3 levels.
During the previous Asian session, the Yen index gained support and rebounded to 750.0. The daily low has moved to 749.2, which indicates that we are slowly progressing to the upside. Now, we need to break the 750.0 level in order to form a new daily high and thus confirm the bearish momentum. Possible higher targets are 750.50 and 751.00 levels.


