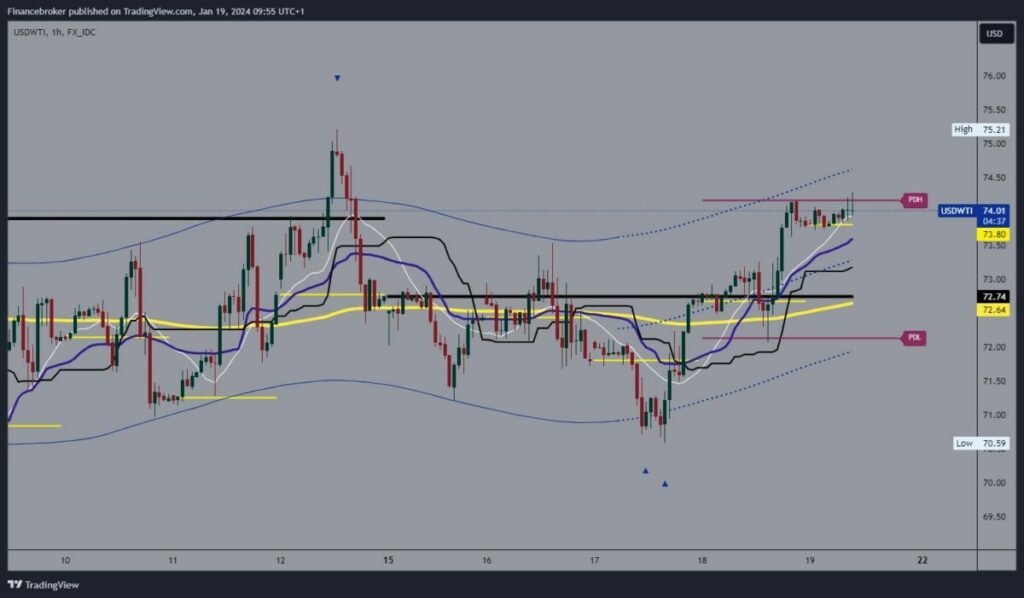
- The oil price is successfully recovering after falling to the $70.59 level on Wednesday.
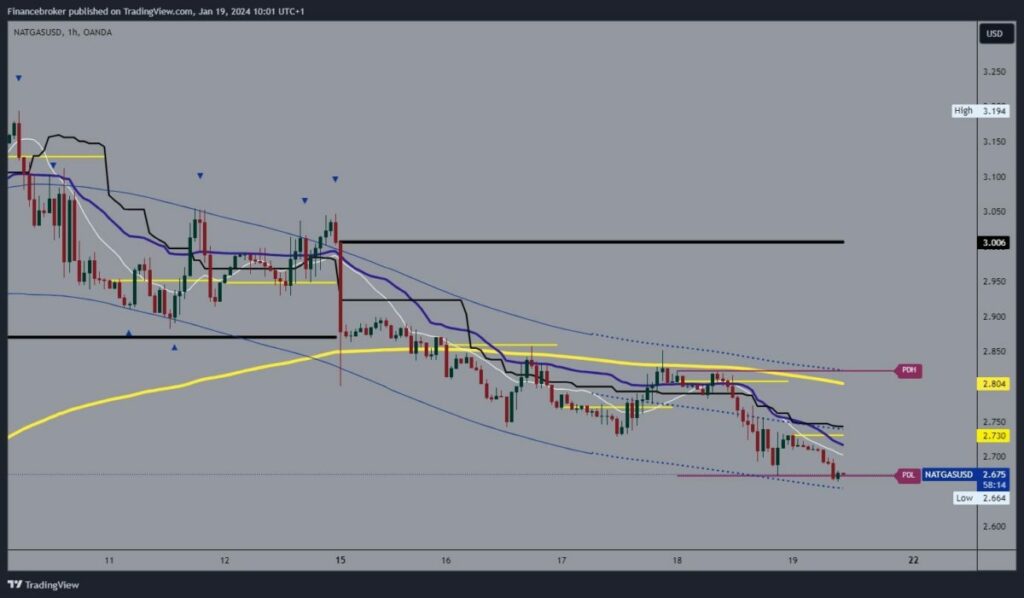
- The price of natural gas has been on a downtrend this week.
Oil chart analysis
The oil price is successfully recovering after falling to the $70.59 level on Wednesday. Most of yesterday's oil price movement occurred around the $73.00 level. After the successful consolidation, we saw an upward impulse and a jump to the $74.00 level. During the Asian trading session, we managed to stay in the $73.80-$74.00 range. We are now looking to start a bullish impulse that will slowly break through the $74.00 level. In the following, we expect to see further growth in oil prices and the formation of a new high for this week.
Possible higher targets are the $74.50 and $75.00 levels. We need a negative consolidation and a pullback to $73.50 as a bearish option. Therefore, we may fall below the support level this morning. The price will be under more pressure to continue further declines. Possible lower targets are $73.00 and $72.50 levels.

Natural gas chart analysis
The price of natural gas has been on a downtrend this week. We are currently looking at a bottom for this week at $2.66. We started the week at $3.00 and have been falling ever since. Additional pressure is created by the EMA200 moving average, which in the previous days did not allow us to move above it. Accordingly, we expect to see natural gas prices continue to decline to lower levels. Possible downside targets are the $2.60 and $2.504 levels.
In order to recover, we need to consolidate above the $2.70 level first. Thus, the decline stops and we begin with positive consolidation to reach higher levels. Possible higher targets are the $2.75 and $2.80 levels. In the area around $2.80, we are facing the EMA200 again, and there we expect a new higher resistance for further growth.


