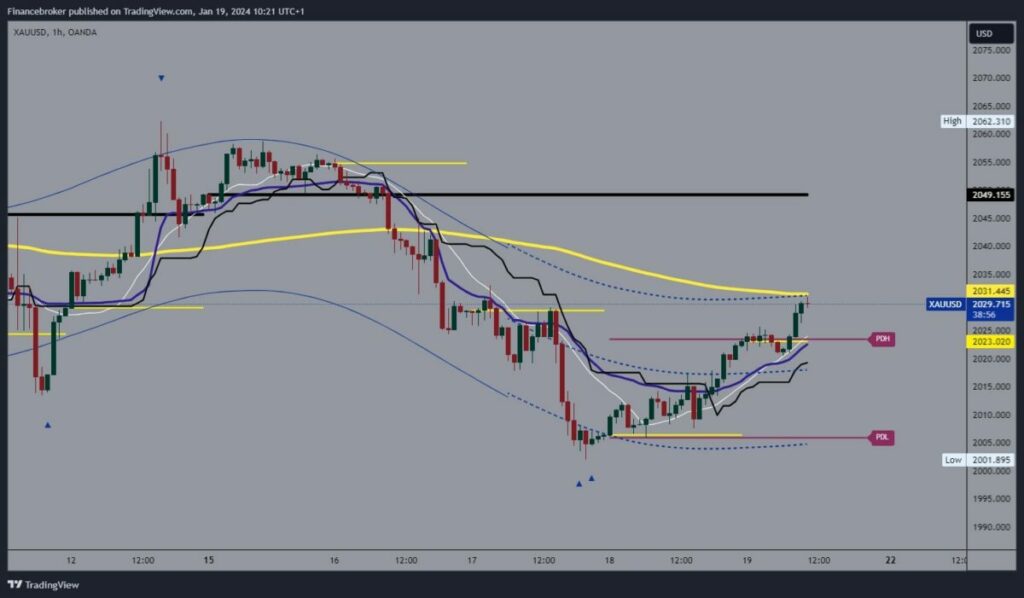
- In the first part of this week, the price of gold fell to the $2001 level.
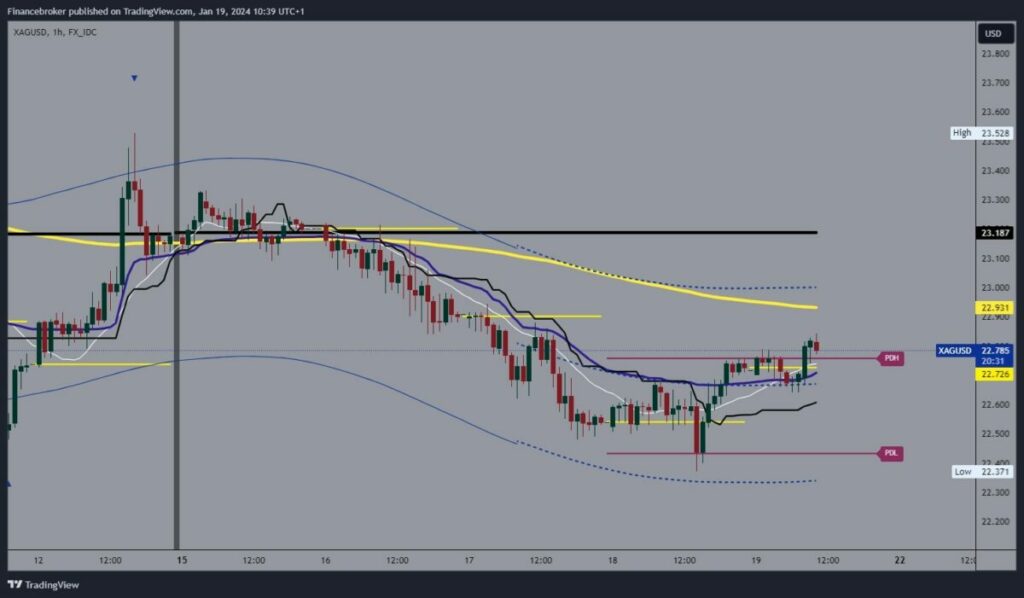
- This week we saw the price of silver fall to the $22.37 level.
Gold chart analysis
In the first part of this week, the price of gold fell to the $2001 level. A low formed on Wednesday evening. After checking, the gold price was successfully consolidated and the decline was stopped at this level. On Thursday we saw a bullish consolidation that continued today until the $2030 level. In the area around this level, we face the EMA200 moving average, which may slow or stop further growth in the price of gold. We need a breakthrough in order to start further growth.
Possible higher targets are the $2035 and $2040 levels. For the bearish option, we need the price to start pulling back to the $2020 support level this morning. A drop below will put us under more pressure to continue the decline, leading to a potential visit to the previous support area. Possible lower targets are the $2015 and $2010 levels.

Silver chart analysis
This week we saw the price of silver fall to the $22.37 level. We started Monday at $23.20, and yesterday we made the aforementioned bottom. We successfully got the support and started bullish consolidation up to $22.80 level. During the previous Asian trading session, the price moved in the range of $22.70 – $22.80. The current pressure is at the upper level, and we expect to see a breakout to the upside and the formation of a new daily high.
Possible higher targets are the $22.90 and $23.00 levels. In the area around $22.90, we are facing the EMA200, which could represent greater resistance to further recovery. We need negative consolidation and a pullback below the $22.70 support level for a bearish option. There, we will be exposed to more pressure, which will lead to further decline. Possible lower targets are the $22.50 and $22.40 levels.


