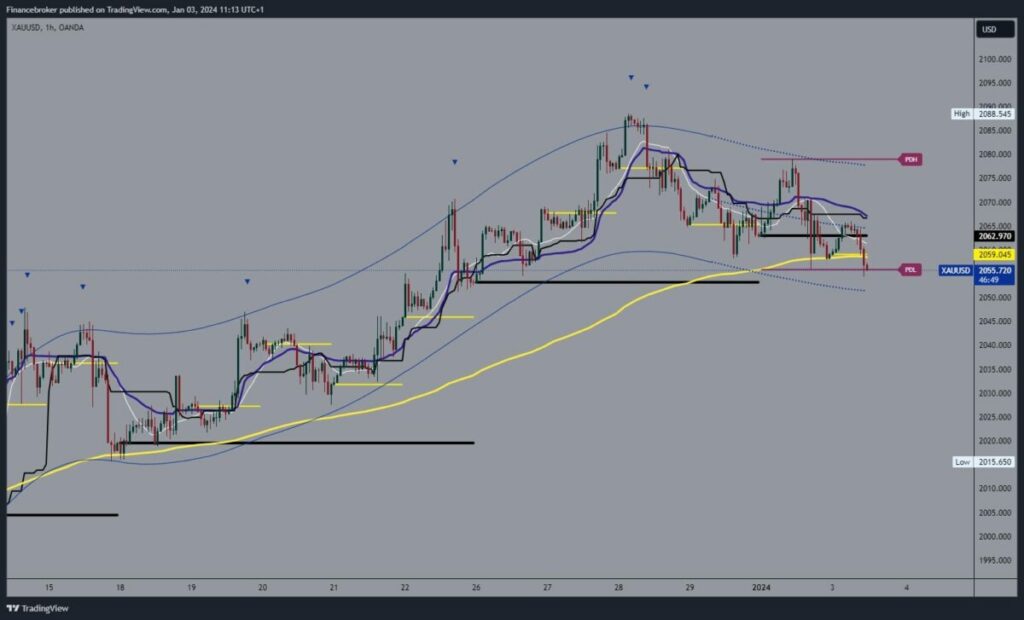
- Yesterday, the price of gold jumped to $2,078, where we formed a new three-day high.
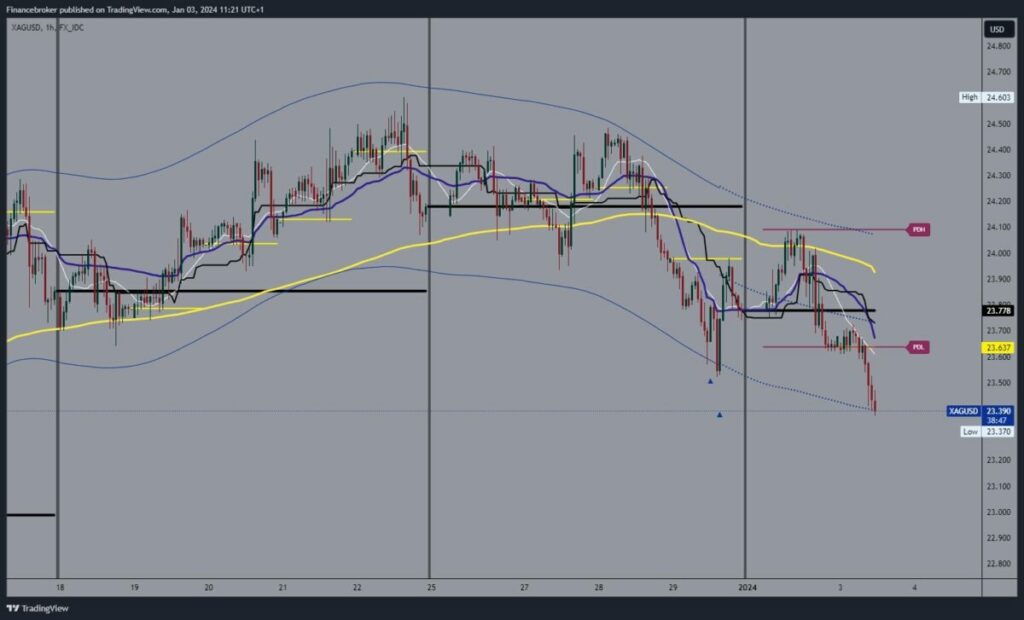
- Yesterday we saw the price of silver rebound from the EMA50 at the $24.00 level.
Gold chart analysis
Yesterday, the price of gold jumped to $2,078, where we formed a new three-day high. There we faced strong resistance and began the decline that continues to this day. This morning we fell to the $2054 level and fell below the EMA50. Such a move increases pressure on the gold price and may send it to lower levels. Possible lower targets are the $2050 and $2045 levels.
We need a positive consolidation and a return above the $2060 level for a bullish option. So we will get back above the EMA 50, and we can get its support. We must then move above the $2065 level to break above the resistance area today. Possible higher targets are the $2070 and $2075 levels.

Silver chart analysis
Yesterday we saw the price of silver rebound from the EMA50 at the $24.00 level. The price drops below that and the bearish consolidation that continues today begins. During the Asian trading session, the price stayed at around $23.60 and then we saw a break down and a new low formed at $23.40. After forming a new low, we get confirmation of the downward momentum and expect to start further decline.
Possible lower targets are the $23.30 and $23.20 levels. A positive consolidation and price return above the $23.70 level is required for a bullish option. After that, we should hang in there and wait for a new impulsive wave to continue the uptrend. Possible higher targets are the $23.80 and $23.90 levels. Additional resistance is at the EMA50 now at $23.90.

Additional video: Weekly news summary from the markets

